I'm Inaara Ali, a senior at Emory University majoring in Data Science (QSS), concentrating in Anthropology and double majoring in International Studies. A lifelong creative writer and enthusiast of comparative cultures and politics, I love to tell stories. In particular, I enjoy uncovering and communicating the hidden stories found within data after extracting insight.
Producing data visualizations and dashboards using R, SQL, and Excel to analyze the progress on critical social welfare
programs across various U.S. regions
Maintaining confidentiality in data management and handling sensitive information
Presenting the dashboard reports and providing recommendations to key stakeholders
@QTM DataThink: Project for the City of Decatur
Feb. 2021 – Apr. 2021
Student Consultant: Project SOAR
Partnered with the Decatur Land Trust to identify at-risk housing properties in Decatur
Predicted which properties are likely to be sold and torn down using R, Excel, and QGIS in a human-centered design
approach using empathy, ideation, prototyping, and testing
Presented analysis to key stakeholders to recommend solutions to preserve or increase affordable housing
@Emory University, Dept. of Political Science (under Dr. Holli Semetko)
Dec. 2020 - Present
Research Analyst: Indian Election Controversy
Analyzing the media coverage about the political wedge issue of the Sabarimala Temple in India’s state of Kerala
Cleaned and organized approx. 24,000 observations from search query in CrowdTangle database
Developed time-series data visualizations using R to showcase the frequency of media sources and the total interactions associated with each post over several months leading up to the Apr. 2019 Kerala elections
Aug. 2020 – Dec. 2020
Research Analyst: U.S. Election Campaign in France
Analyzed the differing political biases of French media outlets “Le Monde” and “Le Figaro” with regards to news coverage of the Nov. 2020 U.S. Election; examined the visibility of the U.S. campaign in France via social media metrics
Managed the query list in CrowdTangle database to generate relevant historical reports of the French outlets
Performed coding for qualitative data on French articles for tone and share of voice measures toward U.S. actors
Jan. 2020 – May 2020
Research Analyst: U.S. Climate Change Policies in France
Collaborated with a team to analyze the tone of French articles about climate change toward the U.S. government
Performed quantitative content analysis on 56 articles and conducted reliability testing for others’ coding using Excel
Guided two undergraduate researchers on the computation of Cohen’s Kappa coefficient of inter-rater reliability
Any questions, comments, or feedback? This is the place! I look forward to hearing from you.
---
---
---
---
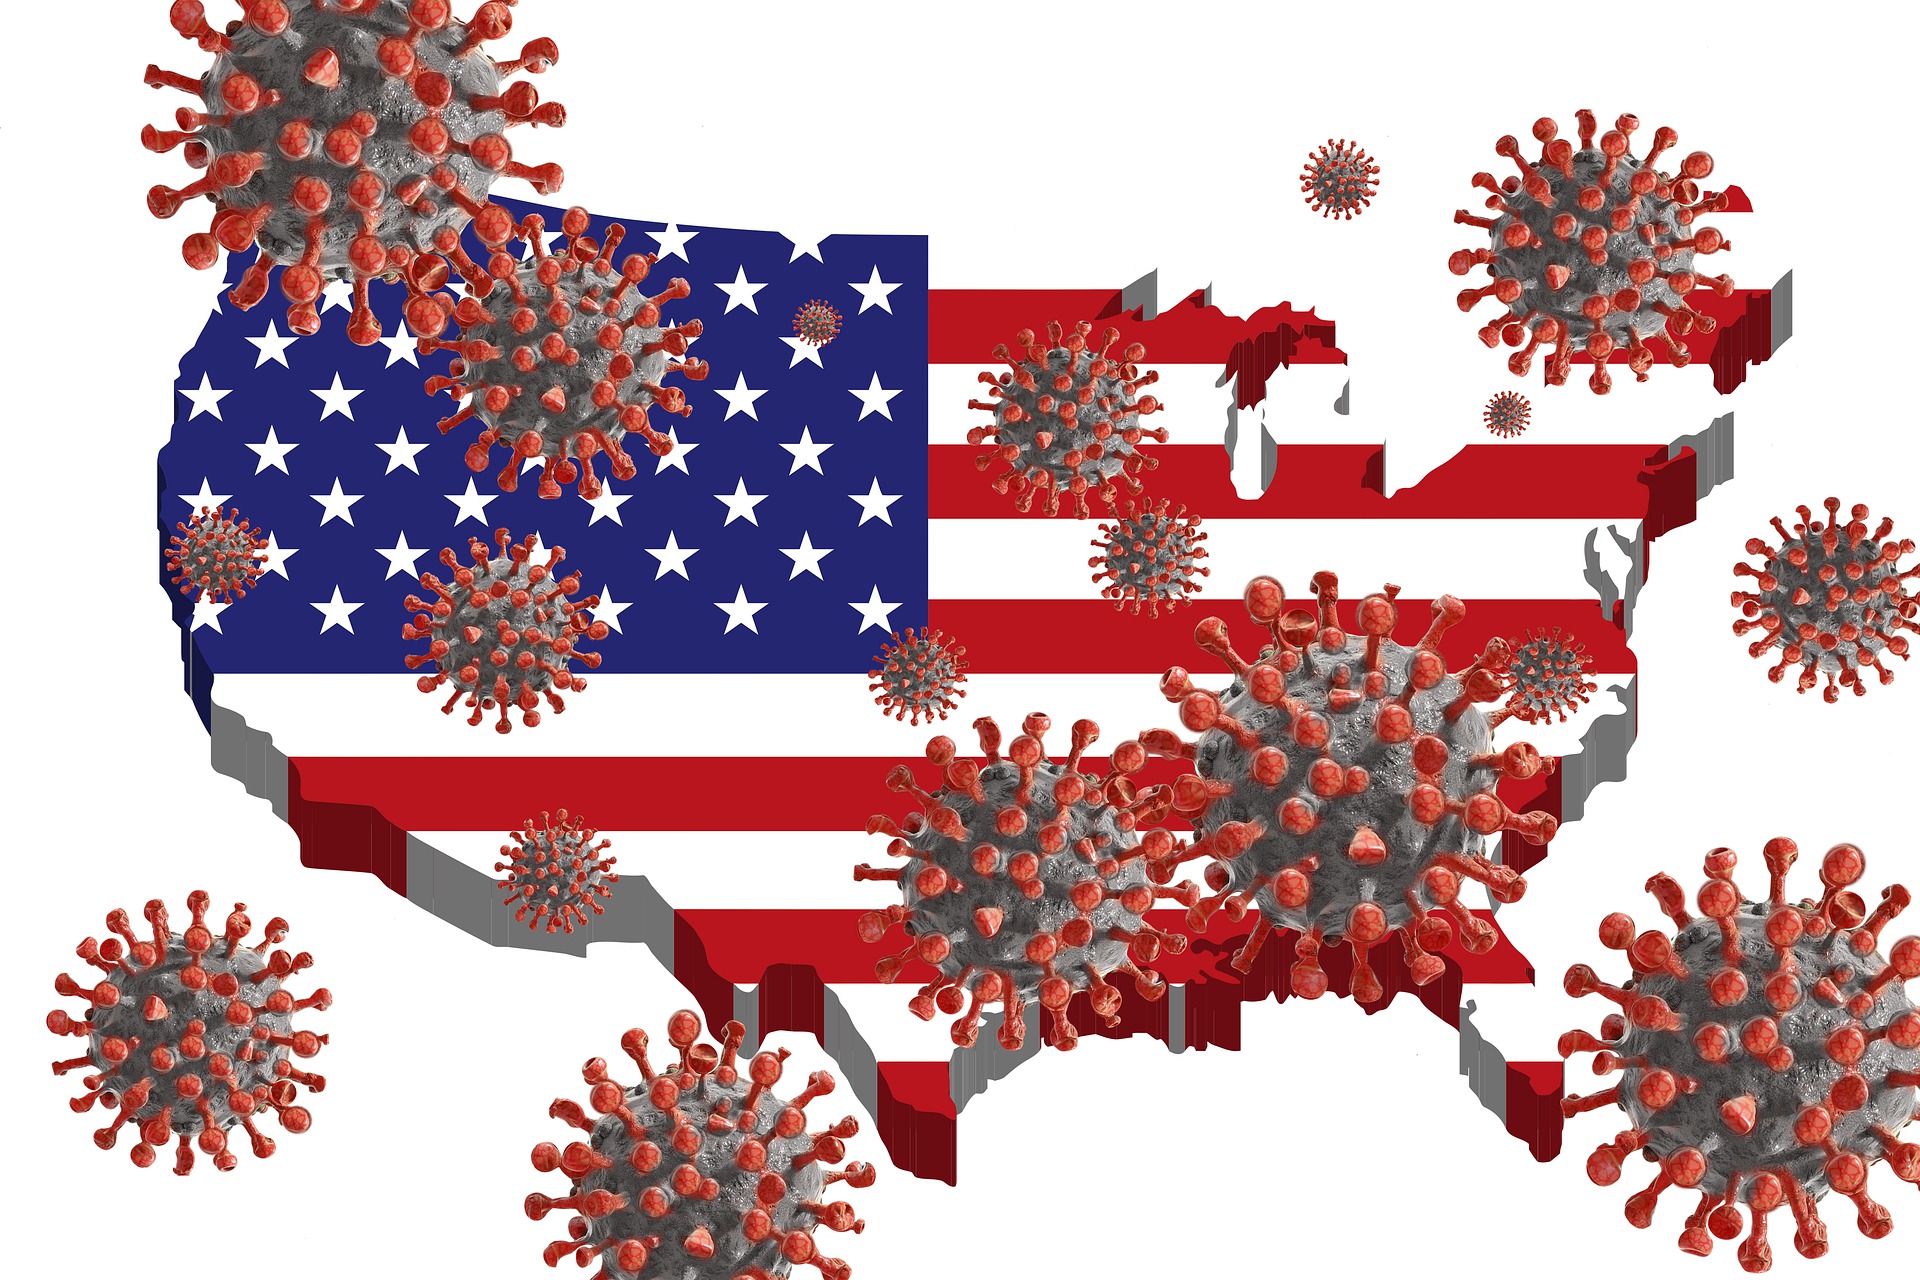
Predictive Power of COVID-19 in the Presidential Election
About
This project examines the relationship between COVID-19 case rates and the United States’ election outcomes from 2016 and 2020 at the state level. The goal was to discover unique insights among political group victory (Democrat and Republican) and COVID-19 cases.
Data sources
Given the CDC's important role during the COVID-19 pandemic, we were interested in using CDC's COVID-19 data tracker for our project. We used the "Data Table for Case Rate by State/Territory" dataset, selecting specifically for
the variables of states, case rates per 100 thousand people, and total number of cases as of November 11th 2020. Since 2020 was also the year of the general election, we wanted to explore the relationship between voting patterns and COVID-19 prevalence in states. Therefore, we created an additional dataset using data from the New York Times dated on November 11th that detailed voting percentages across party lines for the 2020 presidential election. We also used an external dataset that contained voting percentages for Democrats and Republicans in the 2016 presidential election.
Analysis
After some cleaning and joining of datasets, we created a map of the US that shows how states voted in 2016 in terms of percentage by Republican or Democratic Party as well as their COVID-19 case rates. Darker circles indicate higher percentage of voting in the respective party, and larger circles indicate higher COVID-19 case rates. It appears that states with larger case rates, specifically those in the Midwest that range from mid to large circles, tend to be darker red, indicating a higher republican voter percentage in 2016. States on the northeast, however, have bluer and smaller circles. Therefore, we believe that these voting patterns from 2016 had an impact on the prevalence of current COVID-19 cases in the United States.
To explore this further, we created scatterplots with case rates and party vote percentages in 2016 and 2020. In both sets of graphs, there seems to be a positive correlation between COVID case rate and Republican vote percentage. In simpler terms, as Republican vote percentages increase, so do COVID case rates. On the other hand, as Democratic vote percentages increase, COVID case rates decrease. This led to our curiosity on whether higher COVID case rates would drive states to vote blue in the 2020 election. We hypothesized that states in worse conditions in terms of COVID-19 would increase the share of Democratic votes. Here are the 2016 graphs, and in this option we see the 2020 graphs.
We subtracted the 2016 voter percentages from the 2020 voter percentages in each state to get the change in voting behavior within the 4 years. One graph has the change in the Democratic vote, and the other has the change in Republican votes. Positive bars indicate that people voted more in favor of that party in 2020. Looking at the legend, warm colors indicate higher COVID case rates, while cool colors indicate lower COVID case rates. Interestingly, we found that COVID case prevalence may have led to further party polarization. States with yellow, orange, or red colors had positive bars in each of the graphs, showing that people in each state voted more blue or more red. The final count on the election, according to the news outlets, revealed a major increase in votes in general. We believe that COVID could be one of the many factors that motivated voter turnout in this year’s election.
Conclusion
In conclusion, we initially thought that states with higher COVID-19 case prevalence would vote more blue, but our data shows that COVID-19 case prevalence may have caused the votes to become more polarized in this year’s election. Additionally, states that lean more Republican have higher COVID-19 case rates, while states that lean more Democratic have lower COVID-19 case rates. It would be interesting to revisit this idea once the COVID-19 pandemic is over in case there are changes in trends, since we are currently experiencing a much harsher Winter wave of cases across the entire country.
Roles & Attributions
Inaara Ali (me): Exploratory data analysis, data cleaning, and map visualizations; project idea
Se Eun Kim: Dataset joining, data cleaning, and Shiny app
Team members:
Inaara Ali (Me), Se Eun Kim, Neisa Yin, Bo Lee, Dylan Douglas-Brown
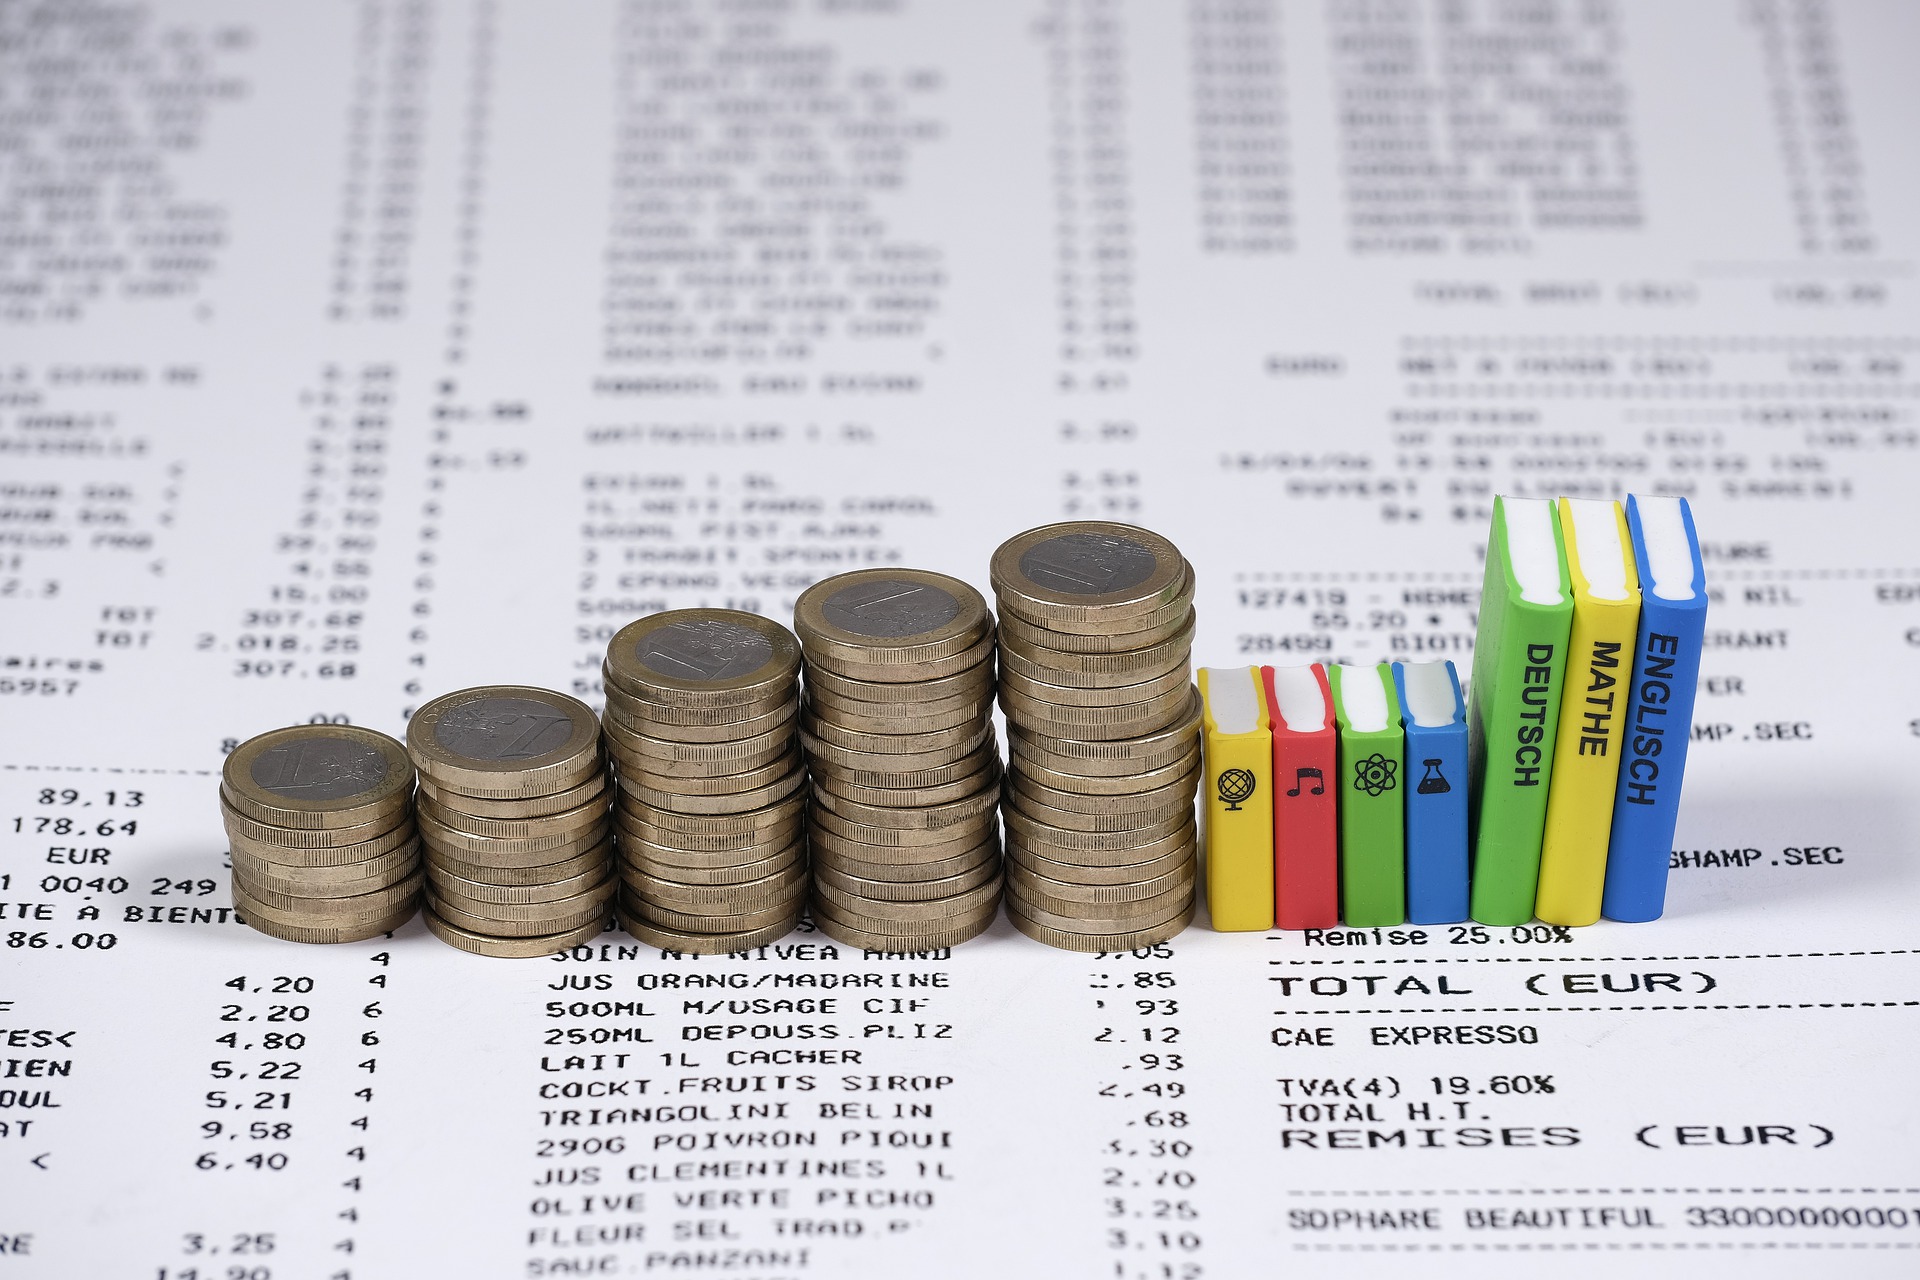
How Government Spending on Education Affects School Enrollment and Academic Performance
Pending publication
Ali, I. & Liu, E. (in press). How Government Spending on Education Affects School Enrollment and Academic Performance. Emory Undergraduate Research Journal.
Abstract
Countries’ government spending on education differs in various percentages of their GDPs, and
affects students variously. But, we don’t have an explicit model for relating government
spending on education to school enrollment and academic performance. Therefore, we are
analyzing primary, secondary, and tertiary school enrollment levels as well as academic
performance from the 2018 PISA test scores and rankings across varying levels of government
spending on education among the ten highest-GDP producing economies of the world. We found
that government spending per student, as well as the rate of enrollment, is greater for tertiary and
secondary levels than the primary level, and that greater government spending does not translate into better academic performance.
Keywords: Government spending; GDP; education; school enrollment; academic performance
I pitched a sustainable start-up idea named Descorn in a team for the Emory HackATL business competition.Descorn combines "design" with "corn." Our mission statement was to create a line of sustainable clothing out of a fine fabric derived from corn to tackle the issues of toxic waste generation from the fashion industry and the problem of overproduction of corn in the country.